2. Calculate 1D metrics for one sample
2.1 Quick start
h1d one IS ./test_data/GSE104334_Ctrl.chr21.matrix.gz \
		50000 chr21 -o Control_IS_chr21
This command would generate a bedGraph file (Control_IS_chr21.bedGraph) for Insulation Score. An example file can be download fron here
| ... | ... | ... | |
|---|---|---|---|
| chr21 | 24300000 | 24350000 | 0.59419 |
| chr21 | 24350000 | 24400000 | 0.604341 |
| ... | ... | ... |
2.2 Usage
The analysis of one-sample metrics cound be run by h1d one sub-command :
$ h1d one -h # type -h for help
usage: h1d one [-h] [-p PARAMETER] [-o OUTNAME] [-d] [-s START] [-e END]
               [--datatype DATATYPE] [--gt GT] [--prefix PREFIX]
               [--maxchr MAXCHR] [-n NPROCESSER] [-t TADFILE]
               type data resolution chromosome

1D metrics designed for one Hi-C sample.

positional arguments:
  type                  Type of 1D metrics,,should be one of
                        {IS,CI,DI,SS,DLR,PC1,IES,IAS,IF}.
  data                  Path of matrix or rawhic file.
  resolution            Resolution of input matrix.
  chromosome            Chromosome number.

optional arguments:
  -h, --help            show this help message and exit
  -p PARAMETER, --parameter PARAMETER
                        Parameter for indicated metrics.
  -o OUTNAME, --outname OUTNAME
                        output name (default: 'metrics').
  -d, --draw            Plot figure for candidate region.
  -s START, --start START
                        Start sites for plotting.
  -e END, --end END     End sites for plotting.
  --datatype DATATYPE   Type of input data: [matrix(default),rawhic,cool]
  --msi MSI             Method for significant interactions: [fithic2,hiccups]
  --gt GT               genome_table file.
  --prefix PREFIX       ${prefix}chr1.matrix.gz
  --maxchr MAXCHR       Maximum index of chromosome (human genome is 22,i.e.)
  -n NPROCESSER, --nProcesser NPROCESSER
                        Number of processors
  -t TADFILE, --TADfile TADFILE
                        Give a TAD file, instead of using building-in TAD
                        calling method
type: type of 1D metrics could be one of {IS,CI,DI,SS,DLR,PC1,IES,IAS,IF}:Directional Index (DI) (PMID: 22495300)
Insulation Score (IS) (PMID: 26030525)
Contrast Index (CI) (PMID: 24981874)
TAD separation score (SS) (PMID: 26431028)
Distal-to-Local Ratio (DLR) (PMID: 30146161)
Compartment PC1 (PC1) (PMID: 19815776)
IntraTADscore (IAS) (Original metric)
InterTADscore (IES) (Original metric)
Interaction Frequency (IF)(Original metric)
Details is shown in our paper: link in the future
-p, --parameterfor each 1D metric is :
| Type | Description | default value |
|---|---|---|
| DI | length of bins | 1000000 |
| IS | square size | 300000 |
| CI | length of bins | 300000 |
| SS | length of bins | 300000 |
| DLR | Local distance | 3000000 |
| PC1 | Gene density file | None |
| IAS | Paramter for TAD calling | 300000 |
| IES | Paramter for TAD calling | 300000 |
| IF | FDR threshold | 0.05 |
Note !! : The sign of PC1 value is arbitrary unless provide a geneDensity file.
-t TADFILE, specify a TAD file (.bed format) to replace the built-in TAD calling method.--msi, specify the method to calculate significant interactions. ‘fithic2’ (default) or ‘hiccups’ is supported.
2.3 Calculate 1D metrics (one-sample)
Use contact matrix:
h1d one CI ./test_data/GSE104334_Ctrl.chr21.matrix.gz \
	50000 chr21 -p 300000 -o control_CI_chr21 --datatype matrix
Use raw
.hicfile:h1d one CI ./test_data/GSE104334_Ctrl.hic \ 50000 chr21 -p 300000 -o control_CI_chr21 --datatype rawhic \ --gt ./test_data/hg19_genome_table.txt
Use raw
.coolfileh1d one CI ./test_data/GSE104334_Ctrl.50000.cool \ 50000 chr21 -p 300000 -o control_CI_chr21 --datatype cool --gt ./test_data/hg19_genome_table.txt
Output will be
control_CI_chr21.bedGraphas described before.
Multiprocessing for all chromomes:
To deal with multiple chromosomes, you should first use dump function in h1d.
To run all chromosomes parallel, do:
h1d one IS ./test/Control/ 50000 all
	--maxchr 22 --prefix observed.KR. -n 30 -o control
chromosome, set chromosome to “all” will compute metrics for all chromosomes.data, if calculating for all chromosomes, the input file should be absolute folder of contact matrix.-maxchr, Maximum index of chromosome (human genome is 22,i.e.). It will compute chromosome 1~maxchr plus chromosome X.--prefix, the prefix of matrix file, please modify the name of zipped matrix to${prefix}chr1.matrix.gz. If you used our dump function, the file should be:├── observed.KR.chr1.matrix.gz ├── observed.KR.chr10.matrix.gz ├── observed.KR.chr11.matrix.gz ├── observed.KR.chr12.matrix.gz ├── observed.KR.chr13.matrix.gz ├── observed.KR.chr14.matrix.gz
so the prefix is
observed.KR.-n, Number of processors
Output would be control_IS_allchr.csv.
2.4 Visulize 1D metrics (one-sample)
Use contact matrix:
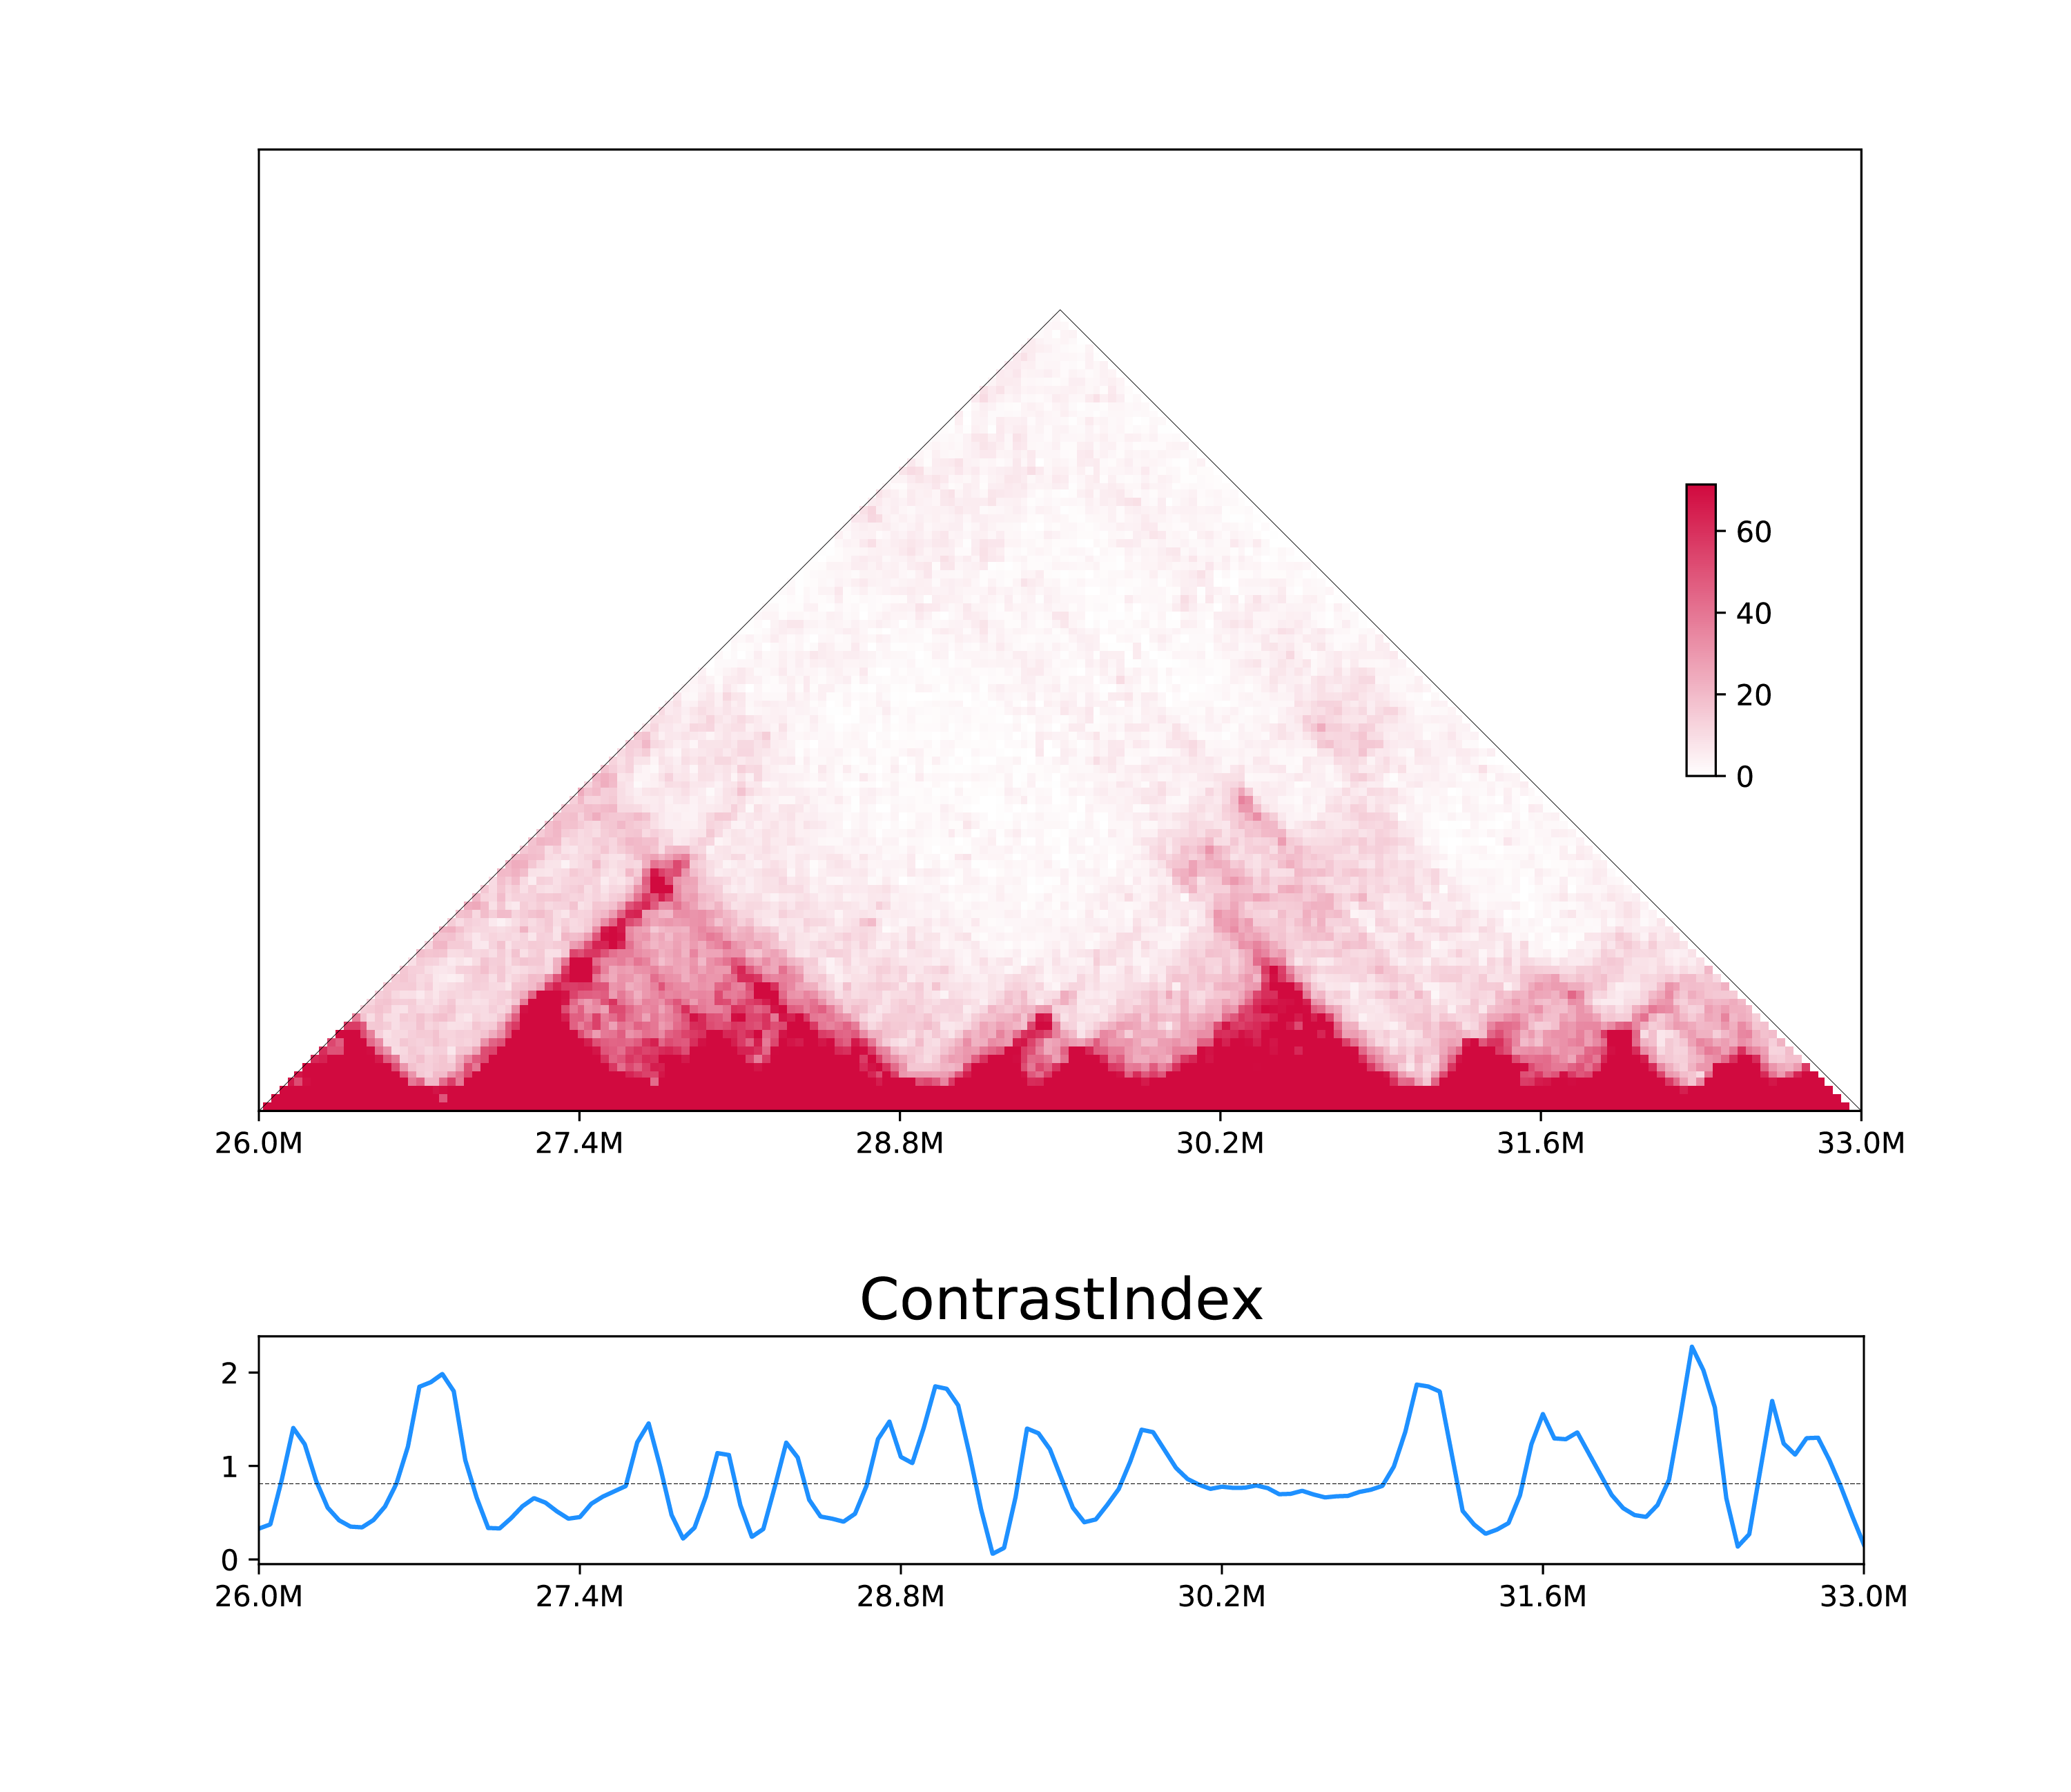
h1d one CI ./test_data/GSE104334_Ctrl.chr21.matrix.gz \
	50000 chr21 -p 300000 -o Control_CI_chr21 --datatype matrix \
  --draw -s 26000000 -e 33000000
Use raw hic:
h1d one CI ./test_data/GSE104334_Ctrl.hic \
	50000 chr21 -p 300000 -o Control_CI_chr21 --datatype rawhic \
	--gt ./test_data/hg19_genome_table.txt --draw -s 26000000 -e 33000000
Use cool file:
h1d one CI ./test_data/GSE104334_Ctrl.50000.cool \
	50000 chr21 -p 300000 -o Control_CI_chr21 --datatype cool \
	--gt ./test_data/hg19_genome_table.txt --draw -s 26000000 -e 33000000
The output will be control_CI_chr21.bedGraph and control_CI_chr21.pdf: