6. Obtain various types of 1D metrics for the same sample
6.1 Calculation
# dense matrix
h1d multitypes IS,CI,DI \
	./test_data/GSE104334_Ctrl.chr21.matrix.gz \
	50000 chr21 -p 300000,300000,1000000 \
	--datatype matrix -o multi_types_metric

# .hic input
h1d multitypes IS,CI,DI \
	./test_data/GSE104334_Ctrl.hic  \
	50000 chr21 -p 300000,300000,1000000 \
	--datatype rawhic -o multi_types_metric --gt ./test_data/hg19_genome_table.txt

# .cool input
h1d multitypes IS,CI,DI \
	./test_data/GSE104334_Ctrl.50000.cool  \
	50000 chr21 -p 300000,300000,1000000 \
	--datatype cool -o multi_types_metric --gt ./test_data/hg19_genome_table.txt
This will output a csv file multi_types_metric.csv like:
| chr | start | end | InsulationScore | ContrastIndex | DirectionalityIndex |
|---|---|---|---|---|---|
| ... | ... | ... | ... | ... | ... |
| chr21 | 23900000 | 23950000 | 0.652077 | 0.667196 | -3.776812 |
| chr21 | 23950000 | 24000000 | 0.636362 | 0.678699 | -3.448456 |
| ... | ... | ... | ... | ... | ... |
6.2 Parameters
$ h1d multitypes
usage: h1d multitypes [-h] -p PARAMETER [-c CONTROLMATRIX]
                      [-o OUTNAME] [--datatype DATATYPE] [--gt GT]
                      [-d] [-s START] [-e END]
                      typelist data resolution chromosome
Required parameters:
typelistthe list of types separated by comma.When calculating one-sample metrics, it should be subset of [IS,CI,DI,SS,DLR,PC1,IES,IAS,IF].
When calculating two-sample metrics, it should be subset of [ISC,CIC,SSC,deltaDLR,CD,IESC,IASC,IFC,DRF]
data, Path of matrix file or raw.hicfileresolution, resolution (50000, i.e.) of given contact matrix, or choosed resolution for.hicfilechromosome, selected chromosome to be analyzed.-p, list of parameters (comma-separated). Please refer to one-sample or two-sample metrics.
Optional parameters:
-o, output name, default: multitypes_metrics-c, contact matrix or .hic file of control sample, which is required when calculating two-sample metrics.--datatype, type of input data: “matrix” (default) or “rawhic”.--gt, genome table file when using raw .hic data.
6.3 Visuliazation
-d, decide whether to plot.
-s, start site for plot.
-e, end site for plot.
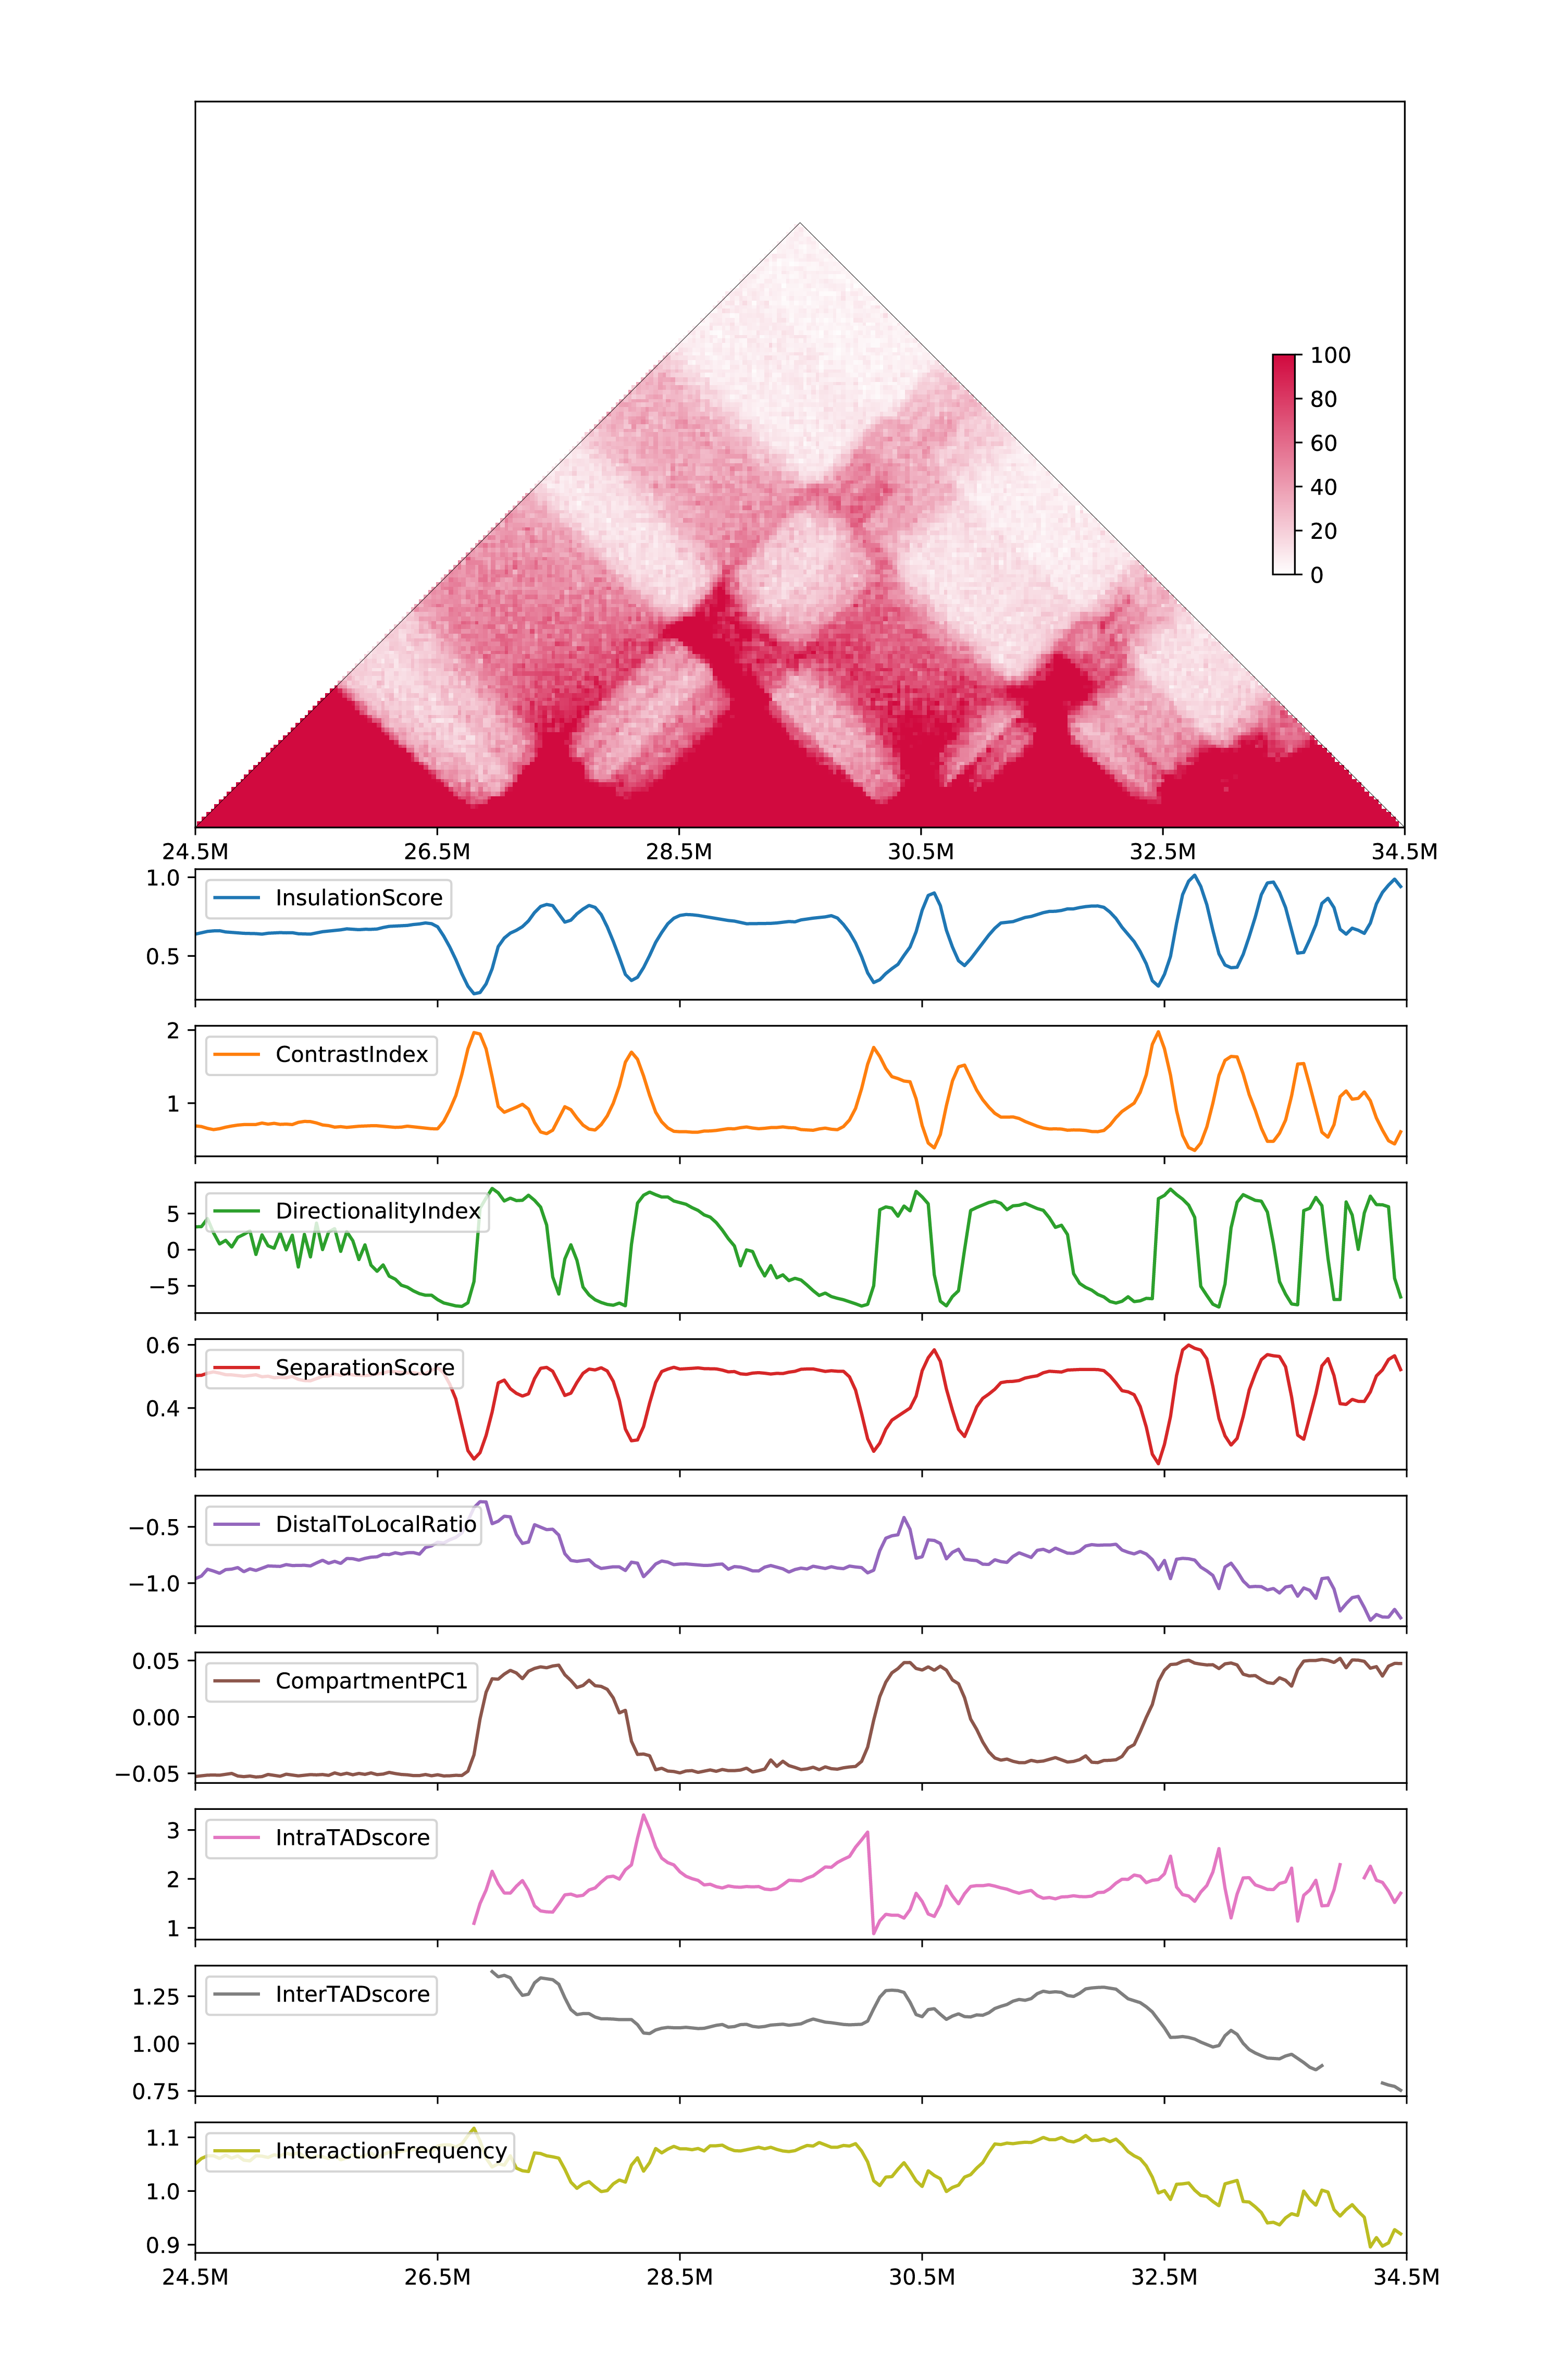
Visulize one-sample metrics (output will be
all_onesample.csvandall_onesample.pdf)
h1d multitypes IS,CI,DI,SS,DLR,PC1,IAS,IES,IF \
	./test_data/GSE104334_Ctrl.hic 50000 chr21 \
	-p 300000,300000,1000000,300000,3000000,./test_data/hg19_geneDensity50000.txt,300000,300000,0.05
	--datatype rawhic --gt ./test_data/hg19_genome_table.txt
	-o all_onesample -d -s 24500000 -e 34500000
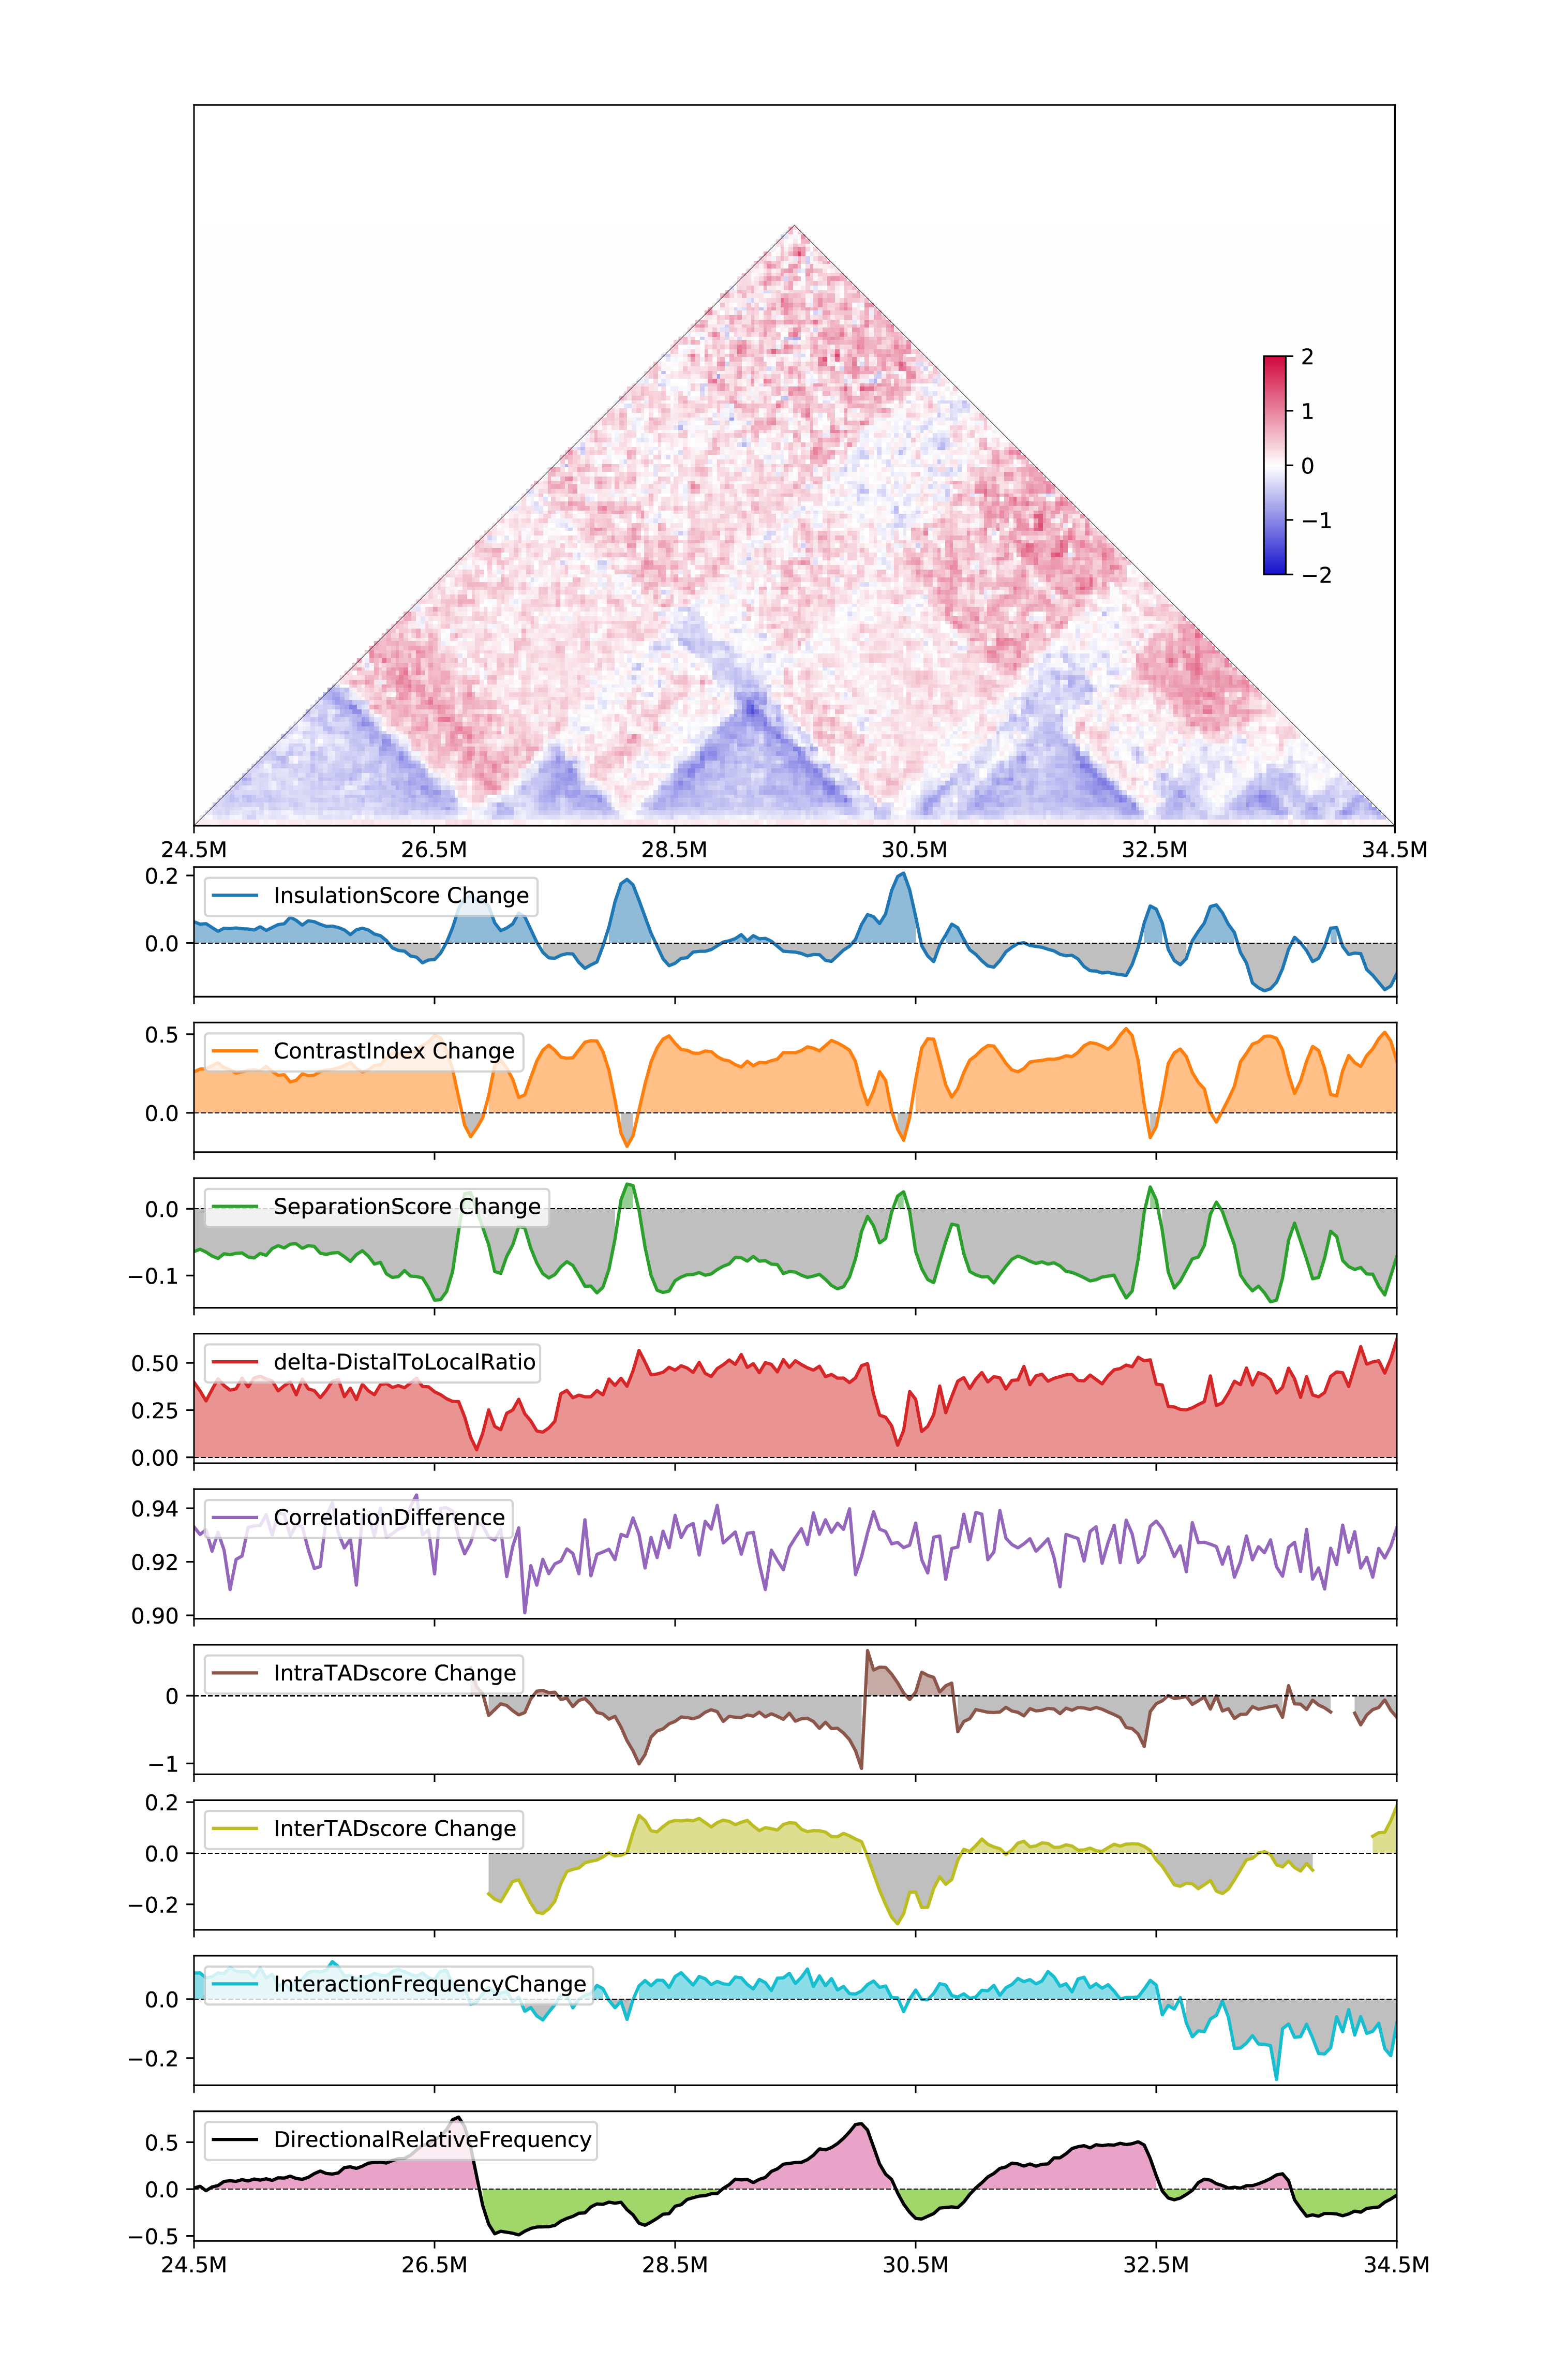
Visulize two-sample metrics: (output will be
all_twosample.csvandall_twosample.pdf)
h1d multitypes ISC,CIC,SSC,deltaDLR,CD,IASC,IESC,IFC,DRF \
	./test_data/GSE104334_Rad21KD.hic 50000 chr21 \
	-c ./test_data/GSE104334_Ctrl.hic \
	-p 300000,300000,300000,3000000,pearson,300000,300000,0.05,200000-5000000 \
	--datatype rawhic --gt ./test_data/hg19_genome_table.txt \
	-o all_twosample -d -s 24500000 -e 34500000