7. Provide basic functions to visualize and handle Hi-C data
$ h1d basic
usage: __main__.py basic [-h] [-o OUTNAME] [-c CONTROLMATRIX]
                         [--datatype DATATYPE] [--gt GT] [--plottype PLOTTYPE]
                         [-s START] [-e END] [--normalize NORMALIZE]
                         mode data resolution chromosome
mode, Running mode,,should be one of {plot,dump}data, Path of matrix file or raw .hic file.resolution, resolution (50000, i.e.) of given contact matrix, or choosed resolution for analyzing.hicfile.chromosome, selected chromosome to be analyzed.--datatype, type of input data: “matrix” (default) or “rawhic”.--gt, genome table file when using raw .hic data.-o, output name, default: unname
7.1 Plot indicated region
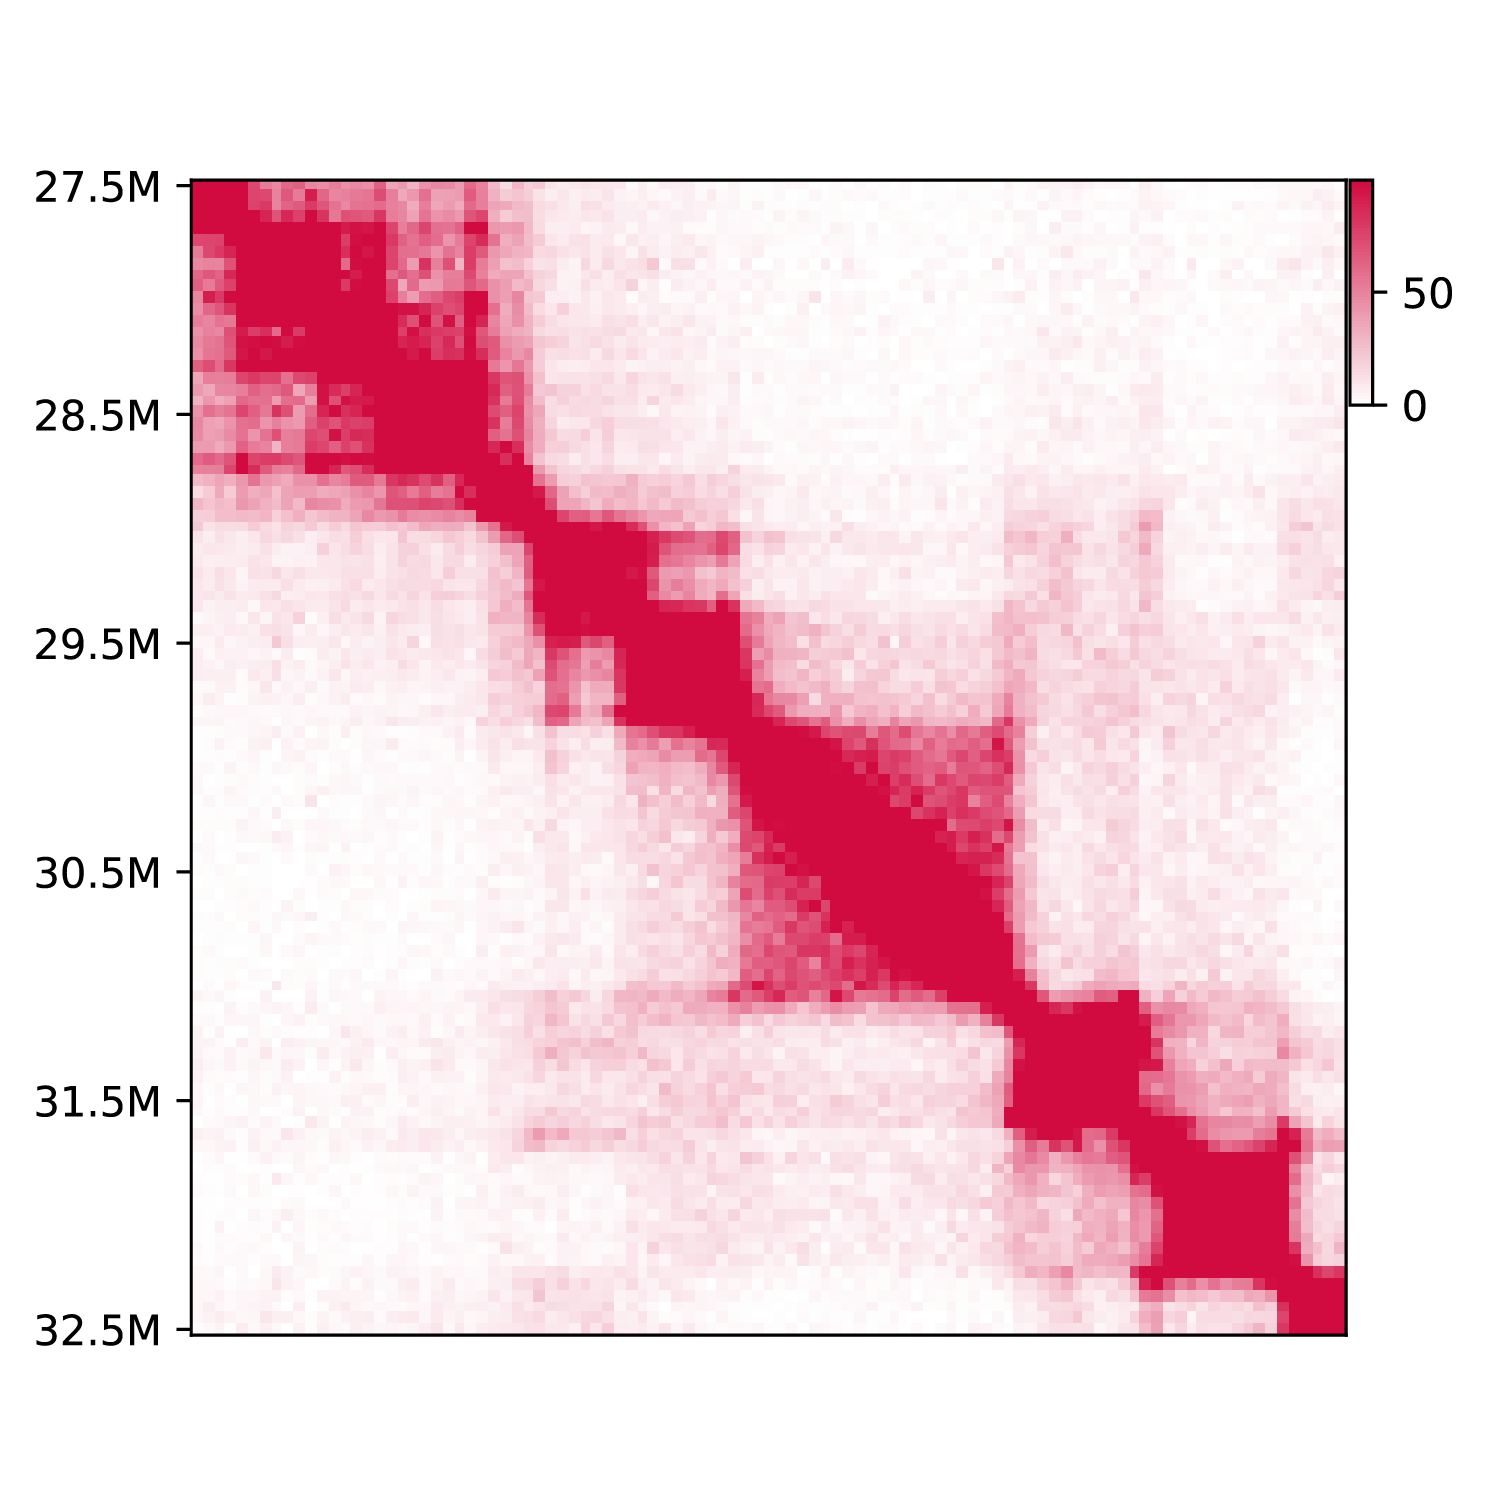
This function provide basic visualization for Hi-C data.
--plottype, Type of plot, could be one of {tri,square,tad}-s, start site for plot.-e, end site for plot.-c, File of control sample. If provided, it will plot differential matrix of treat_vs_control.
h1d basic plot ./test_data/GSE104334_Ctrl.chr21.matrix.gz \
	50000 chr21 --datatype matrix -o testplot --plottype square \
	-s 27500000 -e 32500000
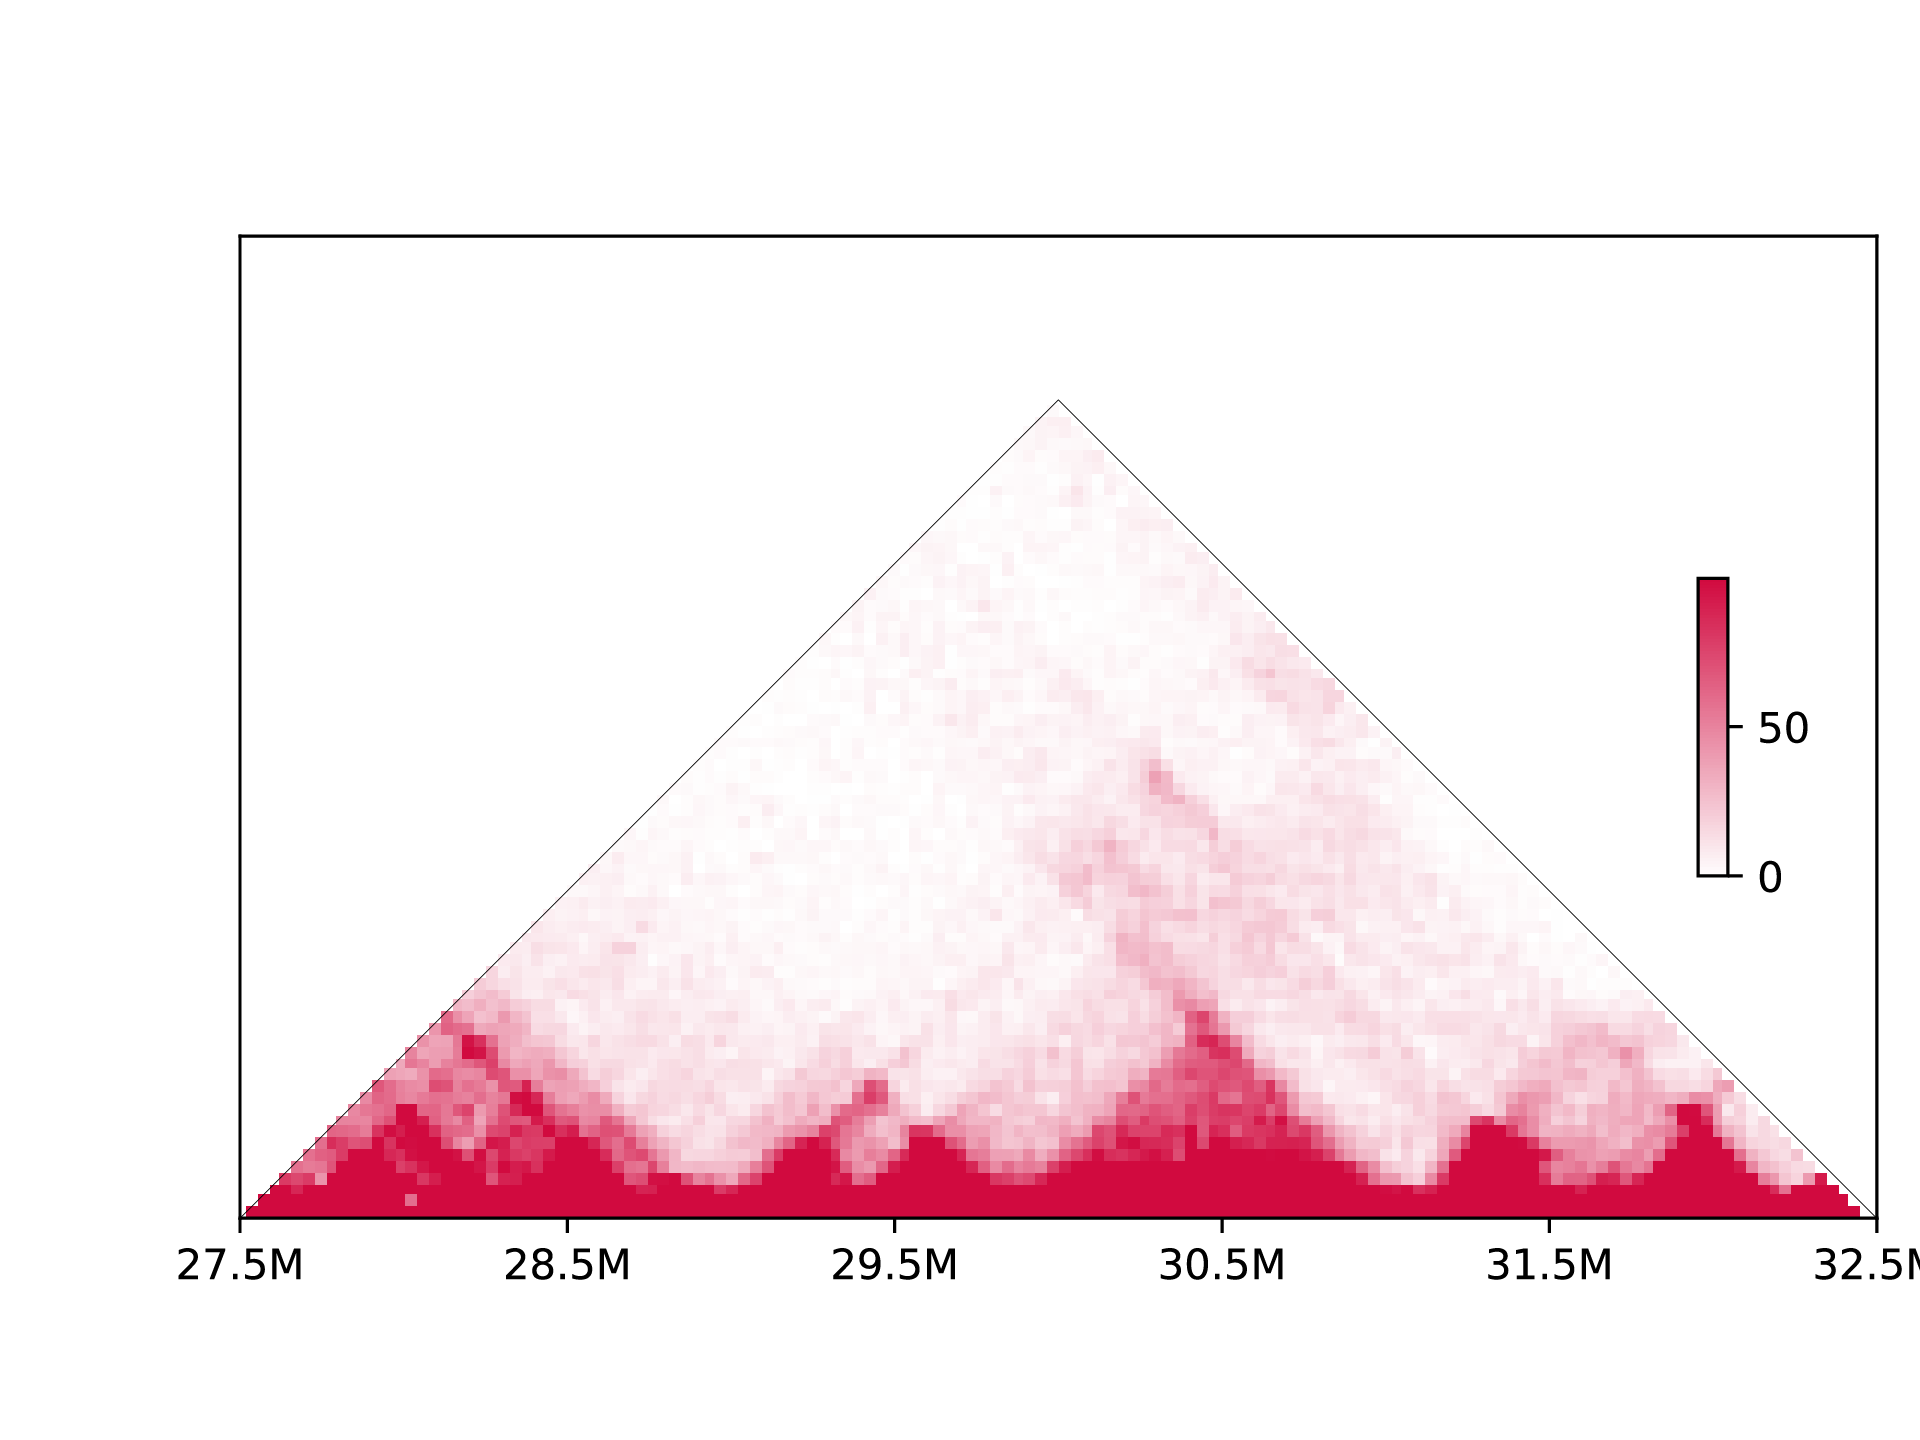
If use --plottype tri:
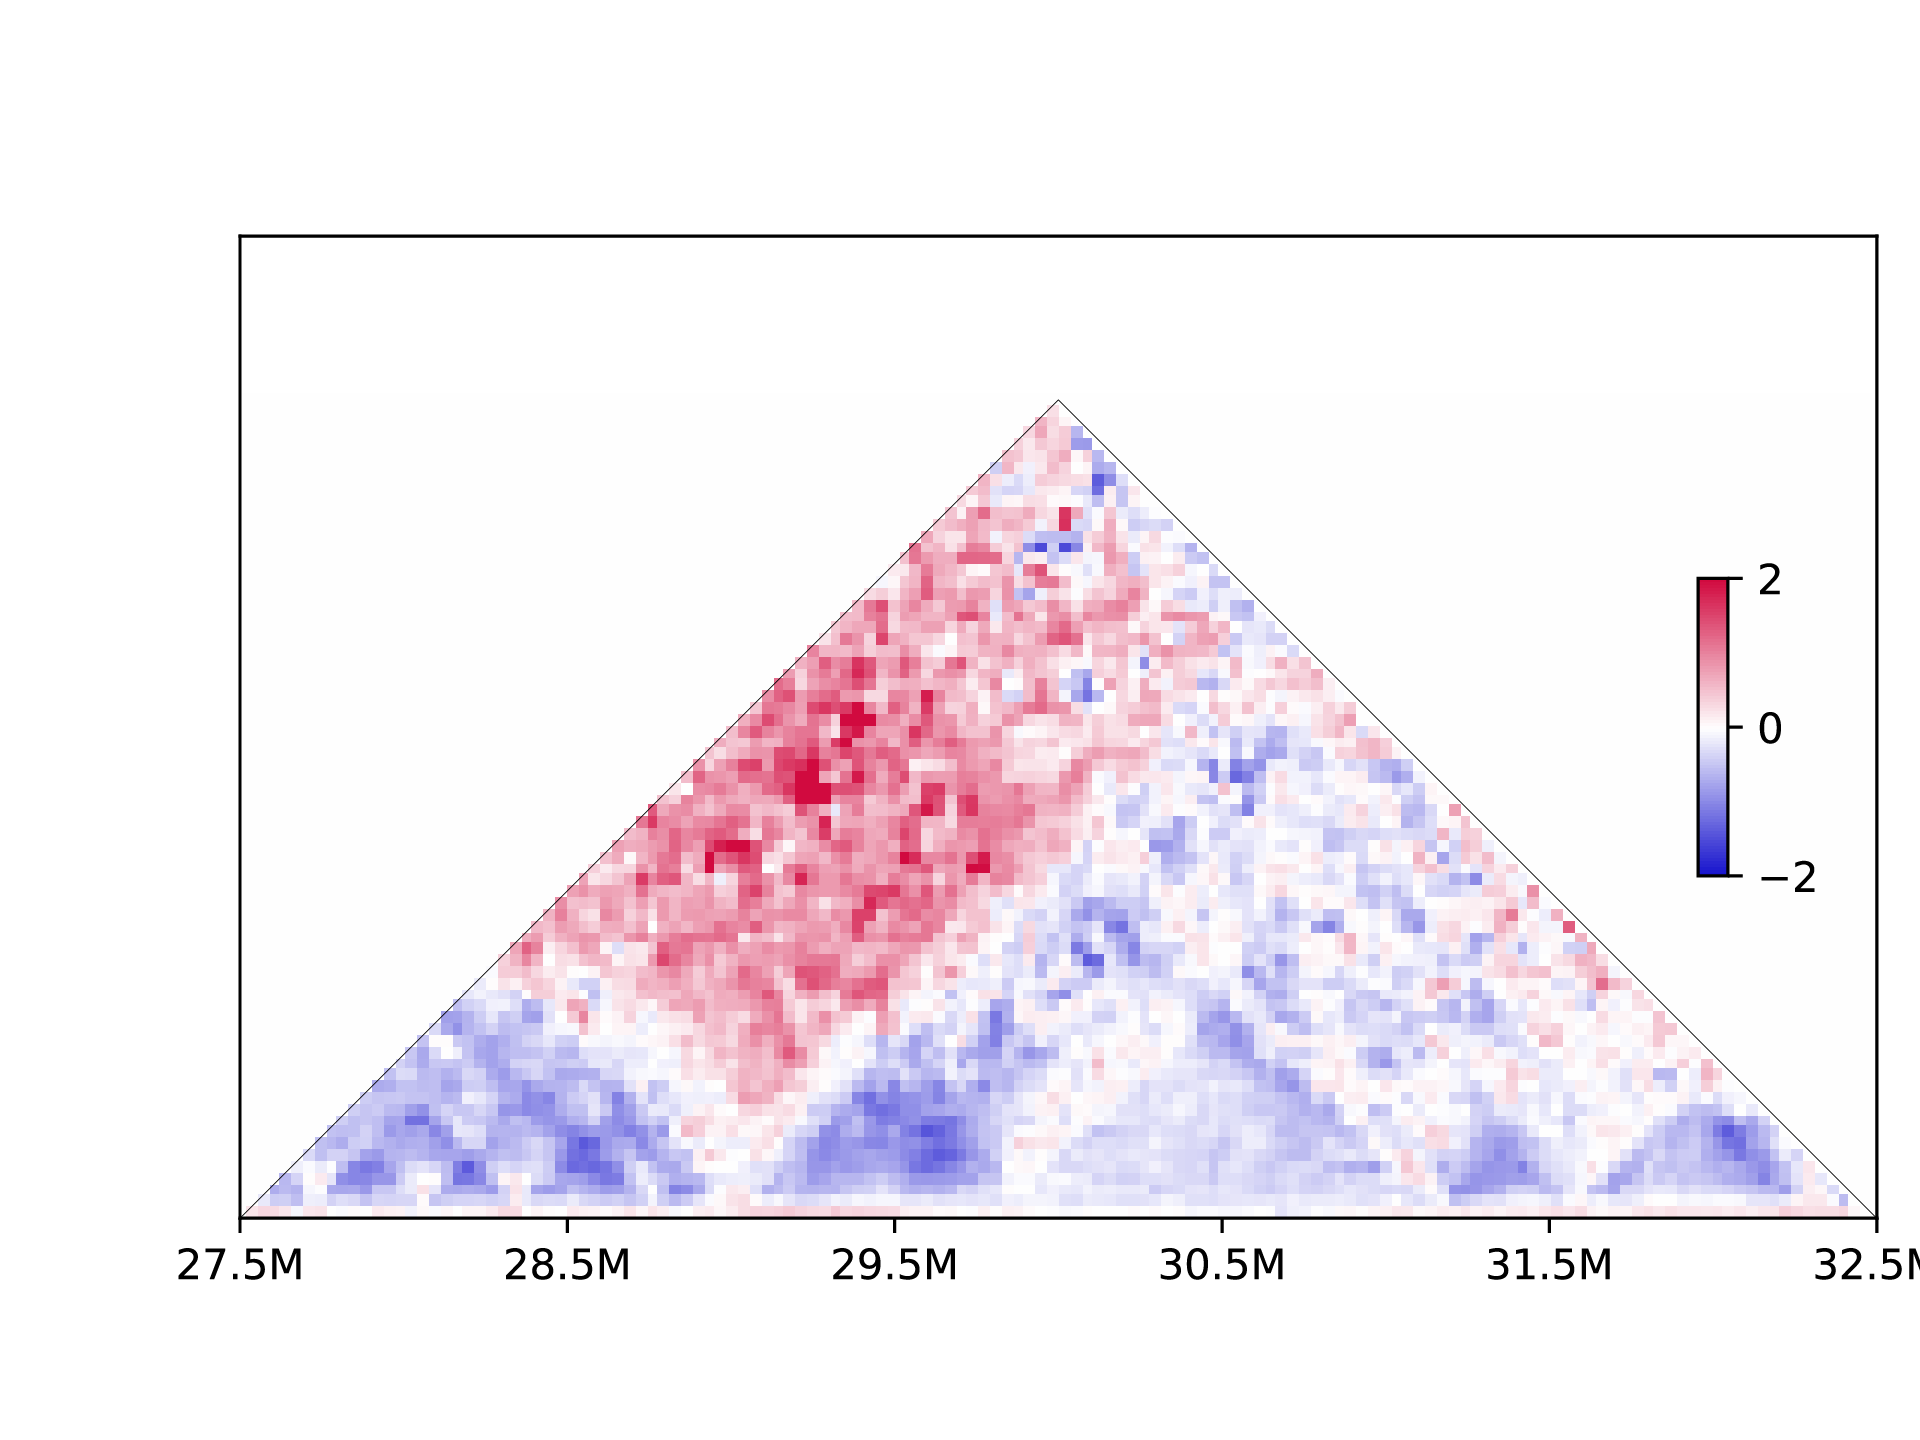
Differential matrix is plotted when the control data is provided:
h1d basic plot ./test_data/GSE104334_Ctrl.chr21.matrix.gz \
	50000 chr21 --datatype matrix -o testplot --plottype square \
	-s 27500000 -e 32500000
7.2 Make contact matrix.
--normalize, Normalize methods {NONE/VC/VC_SQRT/KR}
h1d basic dump ./test_data/GSE104334_Ctrl.hic 50000 chr21 \
	--datatype rawhic -o testdump --gt ./test_data/hg19_genome_table.txt
	--normalize KR
The output will be:
testdump
└── 50000
    └── observed.KR.chr21.matrix.gz
which is dense matrix (zipped) of intra-chromosomal contacts, like:
| 0 | 25000 | 50000 | 75000 | ... | |
|---|---|---|---|---|---|
| 0 | 0 | 0 | 0 | 0 | ... |
| 25000 | 0 | 8 | 3 | 5 | ... |
| 50000 | 0 | 3 | 8 | 4 | ... |
| 75000 | 0 | 5 | 4 | 0 | ... |
| ... | ... | ... | ... | ... | ... |
Dump all chromosomes
chromosome, set chromosome to “all” will compute metrics for all chromosomes.data, must be.hicdata-maxchr, Maximum index of chromosome (human genome is 22,i.e.). It will compute chromosome 1~maxchr plus chromosome X.-n, Number of processors
h1d basic dump ./test_data/GSE104334_Ctrl.hic 50000 all \
	--gt ./test_data/hg19_genome_table.txt --normalize KR -o justtest \
	--datatype rawhic --maxchr 22 -n 30
Output would be:
justtest
└── 50000
    ├── observed.KR.chr1.matrix.gz
    ├── observed.KR.chr10.matrix.gz
    ├── observed.KR.chr11.matrix.gz
    ├── observed.KR.chr12.matrix.gz
    ├── observed.KR.chr13.matrix.gz
    ├── observed.KR.chr14.matrix.gz
    ├── observed.KR.chr15.matrix.gz
    ├── observed.KR.chr16.matrix.gz
    ├── observed.KR.chr17.matrix.gz
    ├── observed.KR.chr18.matrix.gz
    ├── observed.KR.chr19.matrix.gz
    ├── observed.KR.chr2.matrix.gz
    ├── observed.KR.chr20.matrix.gz
    ├── observed.KR.chr21.matrix.gz
    ├── observed.KR.chr22.matrix.gz
    ├── observed.KR.chr3.matrix.gz
    ├── observed.KR.chr4.matrix.gz
    ├── observed.KR.chr5.matrix.gz
    ├── observed.KR.chr6.matrix.gz
    ├── observed.KR.chr7.matrix.gz
    ├── observed.KR.chr8.matrix.gz
    ├── observed.KR.chr9.matrix.gz
    └── observed.KR.chrX.matrix.gz
7.3 Make gene density file for PC1
h1d basic gd refFlat.hg19.txt 50000 \
		./test_data/hg19_genome_table.txt -o hg19.geneDensity.txt
refFlat.hg19.txtis defined by UCSC and should be at least 6 columns as (The first column geneName must not be NA):
| geneName | name | chrom | strand | txStart | txEnd |
|---|---|---|---|---|---|
| RCAN1 | NM_001034679 | chr1 | + | 327876 | 339078 |
| KCNE1 | NM_001077977 | chr1 | + | 377375 | 383871 |
| ... | ... | .. | ... | ... | ... |
50000is the resolution for PC1 analysis../test_data/hg19_genome_table.txtis genome table file (tab-separated) which described the length of each chromosome for your genome reference:
| chr1 | 248956422 |
|---|---|
| chr2 | 242193529 |
| ... | ... |
-ois the output name